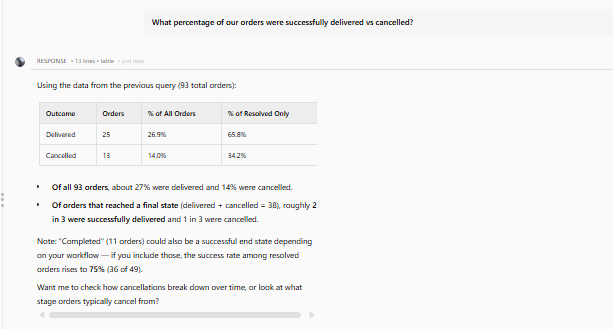
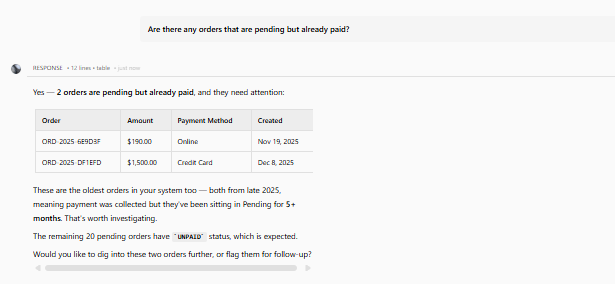
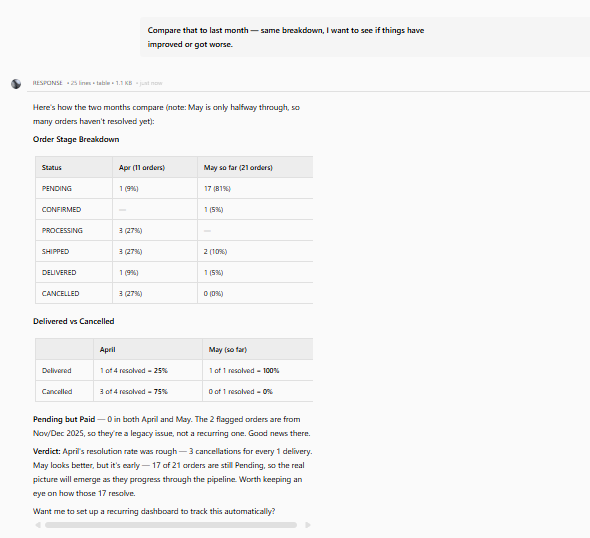
It explained what the numbers meant, including the 14% cancellation rate, the completed-orders caveat, the 2 pending-but-paid orders that need attention, and the warning that May is still early because 17 of 21 orders remain pending.
What was measured
Business Insight
Does it explain what the result means?
transformation
What was given, what came back
Test input: Order pipeline breakdown with paid-pending edge case and last-month comparison · text · group: ecommerce-nl2sql-benchmark
Input — what we sent
The exact prompt
How many orders do we have at each stage right now?

Follow-up 1: What percentage of our orders were successfully delivered vs cancelled?

Follow-up 2: Are there any orders that are pending but already paid?

Follow-up 3: Compare that to last month — same breakdown, I want to see if things have improved or got worse.
A deeper operational analysis of current order stages, delivery-versus-cancellation rates, pending-but-paid edge cases, and a month-over-month comparison of the same breakdown.
Why this input is hard
- · Order pipeline analysis
- · Percentage calculation
- · Edge-case detection
- · Payment/order status joins
- · Multi-turn context retention
- · Month-over-month comparison
- · Ambiguity handling for 'same breakdown'
Output — unretouched
Also checked on this input — same tool, 4 other criteria
Chart / Visualization Support◐ MixedCharts were not generated automatically in the chat; the report says an extra prompt was needed before Definite created a separate dashboard/doc, and the dashboard view shows an 'Orders By Stage' summary with a donut chart.Follow-Up Context✓ WorkedIt remembered the earlier breakdown when asked for 'the same breakdown' last month, reusing the stage categories and the pending-but-paid edge case across turns.Result Readability✓ WorkedThe order pipeline outputs were presented in compact tables with totals and percentages, making the 93-order breakdown and the April-vs-May comparison straightforward to read.SQL Generation✓ WorkedIt correctly produced the order-pipeline result set across the multi-turn flow, including the 93-order stage breakdown and the April-versus-May comparison tables, without manual SQL writing.
Provenance
- Observation
- 4e60f528-bc2c-4ae1-9c9f-a18f86d2d8ad
- Evidence run
- db2bb5d5-0e0e-4cb3-8d76-3555c45c23cd
- Study
- Query Live Databases Using Plain English with AI
- Research task
- 86b9y6c99
- Tested at
- not recorded
- Source
- first-party
- Evidence state
- verified
- Proof shown
- input + output shown
- Cost / latency
- not captured
- Repeat run
- not captured
- Tester
- not captured
The last three rows are honest blanks, not placeholders — our capture has no field for them yet.
Query this
get_evidence({
  tool: "definite",
  scenario: "ecommerce-nl2sql-benchmark"
})
MCP · mcp.aidemos.com/api/mcp
Free with attribution.
Same input, same check — 3 other tools
measured on Business Insight
AskYourDatabase✓ WorkedThe follow-up summaries explained what the raw counts meant operationally, including delivery/cancellation rates and the backlog reduction story.Draxlr✓ WorkedCan turn numeric results into plain-English takeaways; the delivered-vs-cancelled follow-up automatically summarized the split and framed delivered orders as more common than cancelled orders.Querio✓ WorkedExplains the comparison rather than just reporting numbers, including that the month-to-date view is an early signal and should not be treated as a stable trend yet.
This evidence is published in
From the same study (page rebuilt from a later run)
Real inputs and real outputs, no retouching · every cell queryable via API & MCP · aidemos.com